Monday, November 27, 2006

Reading Nasdaq Level II Quotes

I have sometimes used Nasdaq Level II quotes to super fine tune an entry or exit, though it is mind numbing to stare at those screens for any length of time. So far, how I interpret the Level II quotes has mostly been improvisational, but after watching it for a while, I can see how the market makers could play games with this stuff, by bluffing a bid/ask price in the second tier and quickly retracting it -- to make it look like a large "hidden" order that someone wants to sneak into the market to stay under retail traders' price alert radars.

I found a couple interesting forum articles that go a little bit deeper into that:
So far from what I've seen, imbalances over bid/ask sizes do generally play out as support/resistance, respectively. But the quotes changes so fast that it's hard to get a clear read on its significance. The best you could do is squeeze out a few extra ticks for an entry/exit or scalp trade. It would help lower risk, but it also seems like a ton of extra work. Not sure if this is really worth getting into. Plenty of people seem to become successful traders without Level II.

Sunday, November 26, 2006

ETF Trend Divergence

I've been looking more closely at ETFs again, specifically sector-related ETFs to track for ongoing top-down analysis. The issue with multicollinearity got me thinking about relative strength again. So far I haven't been systematic about assessing relative strength, and it just doesn't make sense to continue putting that on the backburner. I'm turning up enough trade setups with different scans that using industry group relative strength to filter and sort the scan results would be a great way to identify the absolute best opportunities.

So, while roaming around the web reading how others track sector ETFs, I came across a really good article in SmartMoney.com titled Profit From Sector ETF Trend Divergence. In addition to identifying the top three ETF families, it also talks about how you can use ETF trend divergence to make money during choppy, sideways markets. An excellent introduction to the topic! It also concludes by saying that if you spot the same divergences repeatedly, you are probably looking at institutional sector rotation.

Saturday, November 25, 2006

Watch List for Week of 11/27

Below are stocks that are in uptrends (based on ADX and +/-DI) that have pulled back to within 1% of the 20-EMA. Many are not yet ready for entry and still need more confirmation. Some already have a confirmed bounce off support. A few cases aren't trades that I'd take, but I want to see how they would turn out -- to see how reliably the +DI crossover high is followed by a successful bounce off the 20-EMA.
  • AYE -- a close above 44.50 would be a 5+ year high.
  • BCR -- resistance at 84.
  • BMET -- significant resistance at 39.10 (multiple touches over 2-year period), so a break above that would be huge. Recent candles show growing sentiment to turn price back up.
  • CDNS -- resistance at 19; close at 19.50 or higher would be 5+ year high; 20-EMA has held at support for the last 2 months. Recent candles show sentiment to turn prices back up.
  • GERN -- resistance at 9.
  • GSIC -- resistance at 18; it failed to hold as new support on the last retest from above.
  • IM -- resistance at 21; small ascending triangle; close at 21 or higher makes a 7+ year high.
  • IT -- resistance at 20.20; increasing volume on up moves; declining volume on down moves; close above 20.20 would make a 6+ year high.
  • KMX -- resistance at 48; next high would be an all-time high.
  • MAT -- resistance at 24; next high would be a 7+ year high.
  • PFG -- support bounce; weekly and monthly charts show healthy uptrend; pullback risk remains on weekly chart.
  • SNPS -- resistance at 23.
  • TAP -- +DI crossover high with pullback to 20-EMA. Significant resistance at 72. Stochastic and MACD are low.
  • TZIX -- symmetrical triangle with decreasing volume.
  • WAT -- +DI crossover high with pullback to 20-EMA. Resistance at 51. Support at 50.
  • ZNT -- flag setup; Bollinger band squeeze

Friday, November 24, 2006

Indicator Tutorials at Worden.com

The Worden.com forums have a lot of good information about what an indicator is measuring. They're presented in short (5-7 min) Flash videos that also show some features in the TeleChart platform. Although I don't use TeleChart (but plan to try it soon), the tutorials on the indicators were still very informative. The ones I found most helpful are:
There are many other short videos on those forums on a variety of topics, mostly related to how to use TeleChart. They're careful not to give advice on how to trade or interpret charts, saying it's beyond what they're allowed to do, but most videos give examples that hint at the possibilities, enough for you to know what to research next.

Tuesday, November 21, 2006

Trading Aphorisms

Trading advice naturally comes in aphorisms. I've collected a few here, though I don't know who originally said them. You've probably heard these before. Most just make sense and are good reminders when you start second guessing and psyching yourself out. I've certainly experienced that. A few are debatable depending on your trading style and need entire books to explain.
  • Buy low, sell high.
  • Buy high, sell higher.
  • The trend is your friend.
    • The trend is your friend until the end where it bends.
  • A rising tide lifts all boats.
  • Don't try to catch a falling knife. Pick it up off the floor.
  • Volume goes with the trend.
  • Manage your money well.
  • Control risk.
  • Take big profits.
  • Take small losses.
  • Don't turn a profit into a loss.
  • Don't add to a loss.
    • Losers average losers.
  • Don't overtrade.
  • Preserve your capital.
  • Never invest all your funds. Keep liquid.
  • Learn how to use orders properly.
  • Trade liquid markets.
  • Fully understand your motivation to trade.
  • Avoid the crowd.
  • Buy the rumor, sell the news.
  • Don't argue with the market. The market is always right.
  • Avoid fear and greed.
  • Don't buy or sell price alone.
  • Develop strategies that work for you and fit your personality.
  • Hard work is essential.
  • It has to be fun.
  • Assume personal responsibility for all market actions.
  • Establish a clear, precise plan of action.
  • Ignore the noise; follow the signal.
  • Patience is your edge.

Saturday, November 18, 2006

Beware Multicollinearity!

I was reading the BollingerBands.com tutorial, and the page about multicollinearity really caught my attention:
A cardinal rule for the successful use of technical analysis requires avoiding multicolinearity amid indicators. Multicolinearity is simply the multiple counting of the same information. The use of four different indicators all derived from the same series of closing prices to confirm each other is a perfect example.

So one indicator derived from closing prices, another from volume and the last from price range would provide a useful group of indicators. But combining RSI, moving average convergence/divergence (MACD) and rate of change (assuming all were derived from closing prices and used similar time spans) would not.
He goes on to explain that RSI, On Balance Volume, and Money Flow make a good combination for avoiding multicollinearity.

StockCharts.com also has an article on multicollinearity.

StockViewPoint.com says their trading signals are carefully chosen to avoid multicollinearity. Their studies combine the following:
  • Intermediate, 1 month and short-term trend lines
  • Overbought/sold indicators
  • Direction of last trade
  • Candlesticks patterns
  • Money Flow
  • On Balance Volume
  • Support and Resistance
  • Gaps and Spikes
  • Relative Strength vs. market
  • Relative Strength vs. industry
  • Industry trend
Personally, I've been gravitating toward using:
  • ADX/DMI for trend
  • Support and resistance
  • Price patterns - especially new highs breaking out of consolidations
  • Candlesticks
  • Stochastics
and applying them to daily and weekly charts.

After reading the StockCharts.com article, I'm noticeably missing is some kind of volume indicator. Normally I just eyeball the volume, looking for a volume surge to back the entry signal provided by the other indicators. But now I'm thinking that adding Chaikin Money Flow or On Balance Volume would make it more systematic.

Watch List for Week of Nov 20

Bullish engulfing candles:
  • AEE - stock in an uptrend. The bullish engulfing pattern is at the support trendline. It's also a Piercing Line candle relative to the down candle on 11/15. MACD and Sto are low and curling up.
  • GIS - long-term uptrend. ADX above 25 on weekly chart. Stock trading near its all-time high. Stochastic showing bullish breakout signal. MACD is low and curling up. The bullish engulfing candle bounced off the 30-EMA with 150% volume. Bollinger bands are squeezing, and an upside breakout from the bands would mean closing at a new all-time high.
  • NTLI - stock in a 10% trading range. Bullish engulfing candle bounced off support around $24.10 with 300% volume. Possible bullish trade with quick exit (or sell half) around $27.
  • PDS - stock in downtrend (so warning). But, stock has shown two bullish engulfing patterns in a row at a major 2-year bottom, with the second engulfing pattern gapping up from the first pattern with 350% volume. MACD histogram just gave its bullish breakout signal, and Stochastics is about to. Even a move up to the 50-EMA would be a 10% rise. If the downtrend is over, the risk-to-reward is excellent. Even if not, could exit half (or all) of the position if the move reaches ~$27.30. A hesitation at $25.50 resistance would be a warning to get out fast.
Bearish engulfing candles:
  • EWBC - stock in short-term downtrend, intermediate-term 10% trading range. The downswing in Oct pushed ADX above 40, but after the more recent upward retracement, MACD and Stochastics are now both in the overbought zone. Bearish engulfing candle came with 120% volume. With ADX still above 25, and -DI over +DI, and the candle bouncing down from the 20-EMA, this seems to point toward a further move down. A close below $36 would be a new significant low.
  • LUV - stock in a downtrend. Bearish engulfing candle comes after what may be an exhaustion gap with a (somewhat) hanging man candle. Possible bounce off upper Bollinger band. Fibonacci retracement (from high on 10/13 to low on 11/03) shows the bearish engulfing candle bouncing off the 61.8% retracement level.
New 200-day highs with volume:
  • TKLC - uptrend, ADX above 40 and rising, +DI above 30 and rising. Made new high with more than 170% volume. If take the trade, stay in as long as the close stays above the 10-EMA.
  • MLHR - no clear trend, but the 13% up gap on 9/21 was a new-all-time high and it recently made another new all-time high. There was a recent breakout from a consolidation flag, which coincided with a breakout from the Bollinger bands, but with not much volume, and it looks to be coming back for a retest. ADX shows strength in both weekly and daily charts and is rising in both charts. If the flag pattern plays out, there should be a move to at least $39.50, based on the height of the flagpole.
Others:
  • ALV - recent upside breakout from a long trading range that ended with an ascending triangle. Appears to be coming back to test the $57.65 old resistance/new support level.

Friday, November 17, 2006

Interviews of Top Traders

I stumbled across TraderInterviews.com while roaming through some news. Very interetsing site! They have interviews recorded with today's top traders asking the usual questions of how they got into trading and what kinds of strategies, patterns, and tools they like to use. I've found that listening to top traders talk about their craft is an excellent way to keep my learning focused on the right things. Sometimes I'll pass up on a technical analysis technique because it just sounds too weird initially, but when I hear an experienced trader talk about how useful the technique is, I'll go back and give it a real, serious look for what I missed.

Thursday, November 16, 2006

Recognizing Candlestick Patterns Properly

Ever since I learned about candlesticks, they've been my chart type of choice. They're definitely easier to read than the traditional bar chart, even when color coded. Though sometimes I will use a line chart plotting only closing prices for checking support and resistance levels.

Later on, I read about candlestick patterns. They were initially tough for me to accept. With strange names like Engulfing Pattern, Harami, Dark Cloud Cover, and (yes) Marubozu, I was just plain skeptical -- "how is this going to help me trade better?" I tried them anyway and had dismal results. They don't work! Friends who had learned about them too had similar experiences -- everyone getting burned on the supposedly powerful engulfing patterns, etc. So why is there so much talk about candlesticks, even whole books on the topic?

It turns out I missed a few important details on how to recognize candlestick patterns properly. It was deceptively easy to see the one, two, and three candle patterns and try trading off them. But thinking those by themselves were sufficient trading signals was a true rookie mistake. For candlestick patterns to give their benefit, they need to be found in the right market environment -- namely trend combined with support and resistance (S/R) -- and be accompanied by the right confirmation and/or indicators. When done properly, several different books say that candlesticks can help you achieve a 70-80% win ratio in trading. Of course, I was thinking to myself that if I had such bad experiences with it before, how is 70-80% wins possible? As I read on in various books, there were a few key points that completely changed the way I now look for candlesticks.

First, the trend. Consider the Bullish Engulfing Pattern, usually depicted like this:
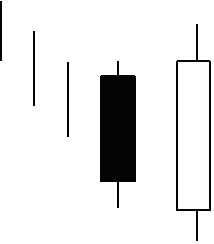
The three vertical lines to the left mean that before the pattern occurs, the price should be headed down coming into the engulfing candle. Then when you see the bullish engulfing pattern, it signals a likely reversal. The mistake I had been making is that I would look for this pattern in a downtrend. But a higher probability approach would be to look for this pattern in a pullback/downswing within an uptrend. Then when the reversal comes, the trade goes with the trend instead of against it.

Second, support and resistance. For reversals, it's better if the candle pattern is at or near a bounce off of support (for bullish patterns) or resistance (bearish). It provides the assurance that the needed buyers/sellers to fuel a bullish/bearish reversal are likely to be there, reducing the risk of the trade and increasing its probability of winning.

Third, confirmation. Some patterns need one additional candle to confirm the pattern:
  • Tombstone Doji and Dragonfly Doji
  • Hammer and Inverted Hammer
  • Hanging Man
  • Shooting Star
The confirming candle should at least show movement between its open and close that is in line with what the pattern is forecasting. And it should come within 1-2 days after the pattern. Ideally, it would close in the direction of the reversal. Without confirmation, trading off these patterns is more risky or aggressive than necessary. Also, for all of the above candles, the longer the shadow, the stronger the signal for a reversal.

Other patterns don't need a confirming candle, through the trend and S/R are still essential:
  • Bullish/Bearish Engulfing Patterns
  • Bullish/Bearish Harami
  • Dark Cloud Cover
  • Piercing Line
  • Morning Star
  • Evening Star
The point about identifying the right trend can't be emphasized enough. Look for Bearish Haramis and Shooting Stars in a downtrending stock! But with an upward retracement heading into the pattern.

Fourth, indicators. Any additional indicators pointing in the same direction will help increase the probability of success. Stephen Bigalow gives greatest emphasis to the stochastic oscillator. Other authors mention MACD, RSI, CCI, ADX/DMI, etc. All of them suggest that whatever indicator you use, it's a bad idea to trade against the indicator, since it would mean there is some opposing momentum that the trade would have to fight.

I still have quite a ways to go before mastering candlestick charting. But at least the basics are taken care of now.. I hope. :) Time to scan and backtest.

Bookmarks for ETF/Index Components

These are bookmarks to Yahoo Finance for certain ETFs/Indexes and some (or all) of their components as of yesterday or today, sorted by weight in the ETF/Index (usually market cap):

Tuesday, November 14, 2006

More Books

Trading Chaos: Applying Expert Techniques to Maximize Profits
by Bill Williams
  • Williams says he is able to use chaos theory to capture 80% of a trend's move, compared to 30% of the move that most traders get.
  • Uses the "fractal of the Elliott Wave" (?) and the science of chaos to look closely at acceleration/deceleration in market momentum.
Profitable Candlestick Trading
High Profit Candlestick Patterns: Turning Investor Sentiment into High Profits
by Stephen W. Bigalow
  • Says that proper use of candlesticks for short-term trades (less than 8 trading days) can be 80% wins, with the 20% losses being small in size due to using tight stops with the candlestick patterns.
  • Says candlesticks can be used very effectively to enhance other technical analysis.

Sunday, November 12, 2006

Watch List: Bullish Engulfing Candles

I was looking at stockcharts.com's scan for bullish engulfing candles. Some interesting possibilities below.

Bullish engulfing candles:
  • CEGE - On Nov 10 with very strong volume at the bottom of a downward move. MACD and Sto are low and curling up. Parabolic SAR giving buy signal.
  • EGP - On Nov 8 & 10. I suppose the Nov 10 candle confirms the Nov 8 candle. There are also dojis and an inverted hammer on the preceding days. Sto is giving buy signal. MACD is curling up. But, ADX made a lower high during the last price high.
  • CG - On Nov 8, candle closed at CG's then all-time high and closed above the upper Bollinger band. ADX rising with +DI making a new high.
  • CHKP - On Nov 10, after a down candle that retested a new support level from a consolidation breakout. It closed outside the upper Bollinger band. ADX line is rising again, and MACD histogram is giving buy signal.
  • GVA - On Nov 10 and 8. MACD and Sto giving buy signals. However, volume was relatively weak, and ADX is not confirming the trend. If enter, put stop just below the rising trendline.
  • IPXL - On Nov 10 with very strong volume; highest close since Jun 12. Highest volume day ever for IPXL since going public in Aug 2005. +DI above -DI with ADX rising and already above 30.
  • TMO - On Nov 10, candle fully engulfed the trading range of both Nov 9 and 8 on strong volume, with a breakout from a short-term consolidation zone. The Nov 10 close is TMO's all-time high, and it was also above the upper Bollinger band. MACD giving buy signal, and Sto turned up. ADX is still rising with +DI far above -DI.
  • VC - Nov 10, in the middle of an upward move. Nov 8 was a fairly strong move, and +DI crossed above -DI on that day. MACD and Sto gave their buy signals on Nov 7. Could take this as an aggressive trade using ADX and +/-DI indicators.
  • VMSI - Nov 10 candle engulfed Nov 9 and 8 with very high volume. The $42 level is now serving as support, after it had been resistance for almost 2 months. +DI crossed above -DI on Nov 7 on the gap up.
  • VRGY - Nov 6-10, two bullish engulfing candles with strong volume. $15 is firm support. If enter, set stop just below $15. MACD and Sto are low and curling up.
Bearish engulfing candles:
  • NIHD - Nov 10. But, MACD and Sto are already low, and ADX and +/-DI haven't confirmed the downtrend yet. So watch for a couple more days before deciding.
  • ZOLT - Nov 10 completely engulfs Nov 9 and engulfs body of Nov 8. This is also a retest of the $23.75-$24 resistance level, which had been the support level of a consolidation zone from Sep-Oct. This appears to confirm the downward breakout from consolidation. -DI is already above +DI. If moves down, expect resistance at $22, $20, and $18. Set set at $23.65.

Stock Scans at StockCharts.com

StockCharts.com has several technical scans that it runs on end-of-day data - you can view the results for free.

Saturday, November 11, 2006

Snap Sheets from Worden Brothers

Worden Brothers, the esteemed creators of TC2000, now have a free charting program called Snap Sheets. It has support for charting fundamentals, comparisons with industry, and for programming your own custom indicators by writing .NET code (C# or VB.NET). Right now, you have to subscribe to a TeleChart service in order to get price data; getting fundamental data costs extra.

Kicker Signal Setups

I wrote a scan for stocks currently with the Kicker Signal setup. As of today (Nov 10), here are the best ones:
  • AIG -- bullish kicker. In uptrend, strong volume, Bollinger band breakout, ADX rising with +DI well above -DI, MACD histogram gave buy signal 3 days ago, and stochastics showing momentum. The kick was also a breakout from a one-month basing pattern, and the Friday close is now testing a high from Jan.
  • PCAR -- bullish kicker. In long-term uptrend. Friday was PCAR's all-time high close. It happened on volume, with a Bollinger band breakout, MACD histogram buy signal, stochastic buy signal, ADX rising with +DI above -DI, and parabolic SAR buy signal.
  • EMR -- bullish kicker on Nov 7. The day after was EMR's all-time high close. Short-term uptrend. MACD buy signal, stochastic buy signal, ADX rising with +DI above -DI. Expect support at 86; if it pulls back to 86, that looks like a good entry.
  • DIS -- bearish kicker, blowout pattern. MACD and stochastic both in overbought region. ADX line declining, -DI rising sharply. Parabolic SAR showing sell signal.
  • EZPW -- bearish kicker with volume. Stochastic in overbought zone. Very strong divergence between MACD histogram and price. -DI crossed above +DI.
  • BGC -- bearish kicker (Nov 9) with very strong volume, stronger than the earlier gap down through support on Oct 31. Failed attempt to break back above the old support trendline on Nov 8; during upward move, volume weakened. Nov 10 was also a strong volume day (intraday chart shows strong selling pressure), with very limited upside momentum. ADX line is falling rapidly; the old uptrend is dead.
  • ING -- bearish kicker (Nov 9) with strong volume. -DI crossed above +DI and went higher than +DI's recent high. But, stay out if price on Monday opens in the gap.
  • RHD -- bearish kicker (Nov 9) with very strong volume. Stochastics in overbought, MACD histogram giving sell signal.
  • SLM -- bearish kicker (Nov 8) with very strong volume. Stochastics and MACD histogram in overbought zones. ADX rising with -DI over +DI.
  • WLP -- bearish kicker (Nov 8) with moderate volume. Volume increasing as price falls. ADX rising above 30 with -DI making higher highs. If enter bearish play, put stop loss at 73.65. Expecting stock to fall below 72.
  • XLV -- bearish kicker (Nov 8-9) with rising volume. -DI spiked up to meet +DI's last high. Thursday and Friday closing prices were outside the lower Bollinger band.

Candlestick Charting and Scanning

This intro to candlestick charting is very interesting. I was particularly intrigued by the Kicker Signal, which the author says is by far the strongest candlestick signal. I've started backtesting this to see just how strong it is, and it does seem to be true -- when you find the signal occurring in the right context and you have a combination of other indicators confirming, the trade has a high probability of success with a substantial profit.

The forums on Worden.com have a discussion thread about what formulas you can use to scan for candlestick patterns using TC2007. That thread also has a link to a variety of other topics -- such as scanning for divergences and price patterns.

Thursday, November 02, 2006

Technical Combination - DMI, 10/20 EMAs, MACD, Sto

This combination of entry rules:
  • Entry alert when +DI(14) crosses above -DI(14).
  • If ADX(14) is not rising, wait for it to rise before entering.
  • If EMA(10) is below EMA(20), wait for EMA(10) to cross above EMA(20).
  • Look to MACD(8,17,9) and Sto(14,5,0) for final confirmation of entry.
would have worked excellently with OSIR on Oct 9 (click to enlarge):


Exiting when MACD histogram peaked the first time after the entry would have gotten you out with a 25% gain on a stock trade. Or if you somehow had the guts to wait and sell at 19 or 20, it'd be about an 80% gain.

Wilder Directional System plays

Watching these:

The ADX(14) on FWLT broke above 30 on Oct 23, and FWLT's price is testing its SMA(20) today. The Wilder Directional System predicts that it should bounce up to at least its previous high.

PLXS ADX(14) broke above 30 on Oct 10. Price is approaching SMA(20).
NDAQ ADX(14) breakout on Oct 11. Price at SMA(20).
PLXS ADX(14) breakout on Oct 18. Price at SMA(20).
JNJ ADX(14) breakout on Oct 18. Price bouncing off SMA(20).
CMC ADX(14) breakout on Oct 20. Price still above SMA(20).
.... more later...

SGP ADX(14) had breakout, but price crashed through SMA(20).

Investing in Adult Stem Cell Research

A CNN Money article from August talked about how biotech companies working with adult stem cells are getting closer to producing treatments. The article mentions three companies in particular:
  1. ASTM (Aastrom Biosciences, Inc.) -- working on treatment to regrow bone tissue
  2. OSIR (Osiris Therapeutics) -- IPO'd on Aug 4. Just began Phase 3 trials for Prochymal for treatment of Acute Graft vs. Host disease, and Phase 2 trials (also Prochymal) for Crohn's disease.
  3. CYTX (Cytori Therapeutics, Inc.) -- working on using patient's adipose tissue for breast reconstruction