Edwards' and Magee's Evaluative Index using Wilder's DMI
In Technical Analysis of Stock Trends, Edwards and Magee describe a simple technique of measuring market breadth that they call the Evaluative Index (from Ch. 37, "Balanced and Diversified"). Construction of the index goes like this:
- Let's say you're watching the daily charts of 100 stocks.
- At the end of the week, mark each chart as being in an uptrend or downtrend.
- Tally the results to determine whether you are overall bullish or bearish, and to what degree.
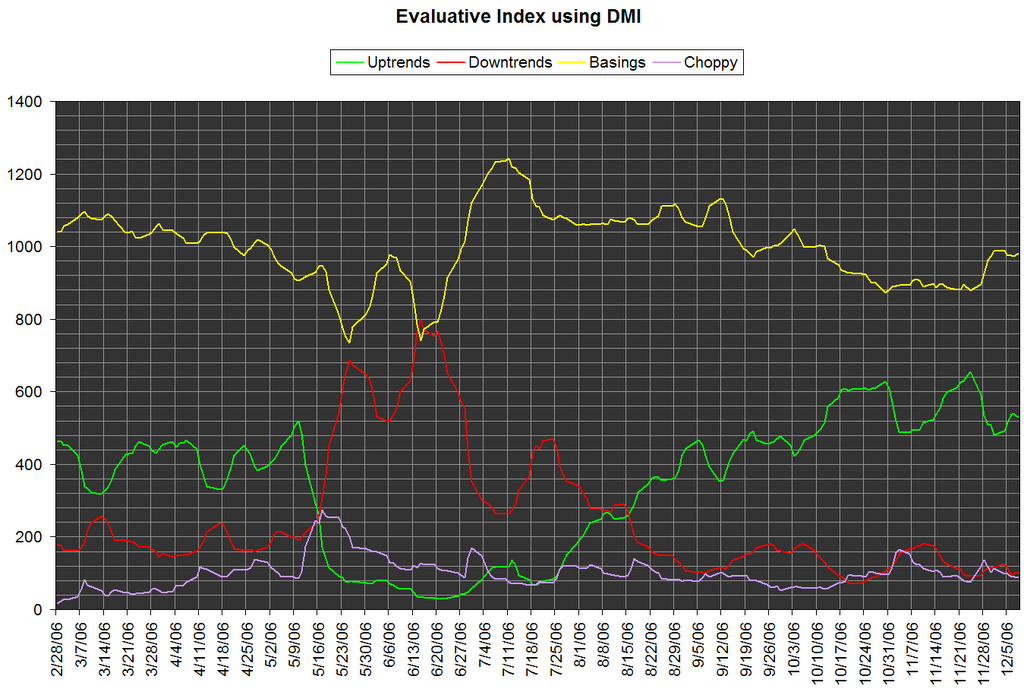 I've modified the index construction to count uptrends and downtrends only when ADX >= 25. With ADX < 25, the stock is either basing or choppy, which just has to do with how frequently the +/-DI indicators cross. (I'm still experimenting with whether basing vs. choppy is a useful distinction.) The important part to look at is the relationship of uptrends to downtrends.
Notice in the week of May 9-16, 2006 that the number of uptrends dropped sharply, with the number of downtrends rising sharply the week after. As this crossover unfolded, it would have been wise to close bullish positions and then wait for a good entry for bearish trades.
Now look at the period from July-Nov. A crossover occurred in mid-Aug, this time with uptrends taking the dominant position and increasing in its dominance. The green "uptrends" line itself made a series of higher highs and higher lows. Broad market indexes (DIA, SPY, QQQQ) were definitely in an uptrend for most of this period.
So what's in store going forward? Of course, it's always hard to say for sure. What we can see so far is that in the first week or two of December, we see the green "uptrends" line hesitating. The red "downtrends" line is flat, but the yellow "basings" line recently had a sharp rise. For the broad market uptrend to continue, we'd like to see the green line avoid making a lower low. So it seems like a time to be cautious, but still bullish.
posted by Armand @ 2:49 PM
1 comments
![]()

1 Comments:
Hi there. Great Blog. I have read many of your posts in the forums at Investools. I have been an Investools student for about a year now and have learned sooo much. I have learned quite a bit from your posts as well. Keep up the great work. How are you doing since you started investing? Thanks again.
Post a Comment
<< Home