Getting the Story Behind the Story
Candlesticks can be tricky creatures. Often enough, I'm finding that it's worth taking a little bit of extra time to look at the intraday anatomy of a candle to get a better read on what the candle is actually telling you. It takes less than a minute to get the deeper insight. Here's an example from MSFT on Dec 8, which shows a bullish engulfing candle with decent volume:
 Looks pretty good. On Dec 8, MSFT opened at 28.82 and closed at 29.40, a 2% move on volume that created the bullish engulfing candle! But take a look at MSFT's intraday chart (one-minute bars) for Dec 8:
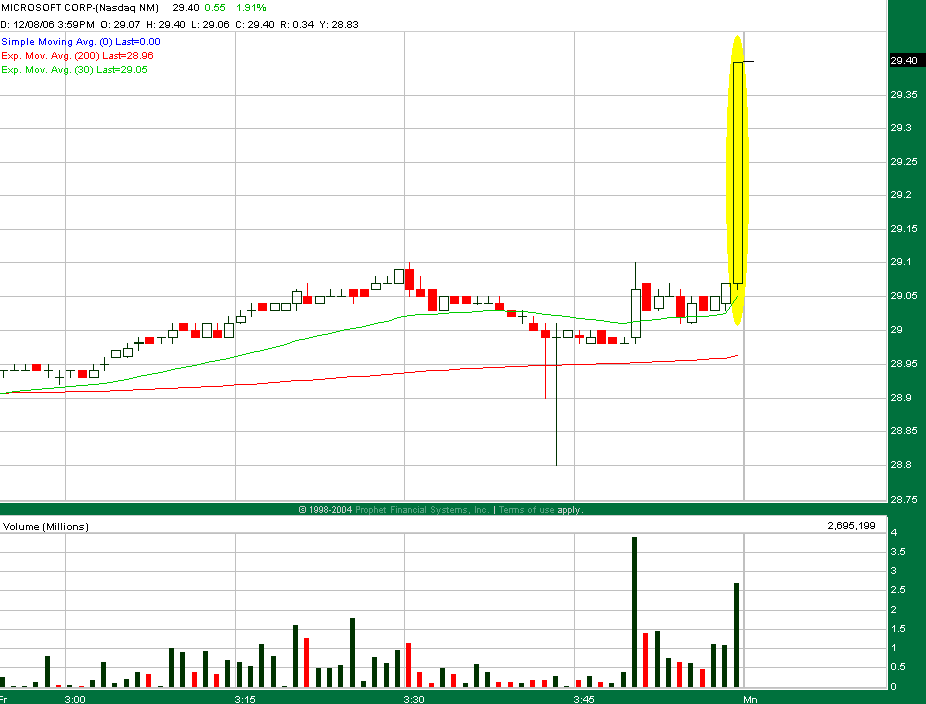 WHOA, what's up with that last minute of trading? MSFT jumped from 29.07 to 29.40 in one minute? Uhh, hmm... There was volume to go with it, but just a few minutes before, there was an even larger volume spike but with a much smaller price movement. And I didn't see any news to drive such a move. Mysterious. In this case, I was curious enough to crack out the time-and-sales sheet and look at the tick-level data:
 (Quick explanation of this T&S sheet. The "T" means a trade. The "A" and "B" are the ask and bid quotes; they change frequently per exchange, and you are seeing only the best quotes on that exchange's order book. Green highlight means the trade occurred on an uptick; red means on a downtick.)
I drew a yellow box around the key transaction that occurred at 29.40. It was a single big order for about 22.8M shares. An institution? An insider? Not sure (didn't see an SEC filing yet), but with the rest of the market trading in the 29.07-29.13 range, I'm inclined to go with the market's figure as the actual closing price. (Besides, after-hours trading closed at 29.20.)
In the end, excluding the large order still left a bullish engulfing candle, just not nearly as strong as the one we originally saw. But it is also helpful to know that some entity out there thought that 29.40 was a good price to grab 22.8M shares ($670M total) in a single last-minute blast.
posted by Armand @ 12:12 AM
0 comments
![]()

0 Comments:
Post a Comment
<< Home