Recognizing Candlestick Patterns Properly
Ever since I learned about candlesticks, they've been my chart type of choice. They're definitely easier to read than the traditional bar chart, even when color coded. Though sometimes I will use a line chart plotting only closing prices for checking support and resistance levels.
Later on, I read about candlestick patterns. They were initially tough for me to accept. With strange names like Engulfing Pattern, Harami, Dark Cloud Cover, and (yes) Marubozu, I was just plain skeptical -- "how is this going to help me trade better?" I tried them anyway and had dismal results. They don't work! Friends who had learned about them too had similar experiences -- everyone getting burned on the supposedly powerful engulfing patterns, etc. So why is there so much talk about candlesticks, even whole books on the topic?
It turns out I missed a few important details on how to recognize candlestick patterns properly. It was deceptively easy to see the one, two, and three candle patterns and try trading off them. But thinking those by themselves were sufficient trading signals was a true rookie mistake. For candlestick patterns to give their benefit, they need to be found in the right market environment -- namely trend combined with support and resistance (S/R) -- and be accompanied by the right confirmation and/or indicators. When done properly, several different books say that candlesticks can help you achieve a 70-80% win ratio in trading. Of course, I was thinking to myself that if I had such bad experiences with it before, how is 70-80% wins possible? As I read on in various books, there were a few key points that completely changed the way I now look for candlesticks.
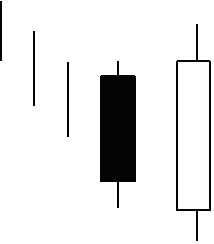
First, the trend. Consider the Bullish Engulfing Pattern, usually depicted like this:
 The three vertical lines to the left mean that before the pattern occurs, the price should be headed down coming into the engulfing candle. Then when you see the bullish engulfing pattern, it signals a likely reversal. The mistake I had been making is that I would look for this pattern in a downtrend. But a higher probability approach would be to look for this pattern in a pullback/downswing within an uptrend. Then when the reversal comes, the trade goes with the trend instead of against it.
Second, support and resistance. For reversals, it's better if the candle pattern is at or near a bounce off of support (for bullish patterns) or resistance (bearish). It provides the assurance that the needed buyers/sellers to fuel a bullish/bearish reversal are likely to be there, reducing the risk of the trade and increasing its probability of winning.
Third, confirmation. Some patterns need one additional candle to confirm the pattern:
- Tombstone Doji and Dragonfly Doji
- Hammer and Inverted Hammer
- Hanging Man
- Shooting Star
Other patterns don't need a confirming candle, through the trend and S/R are still essential:
- Bullish/Bearish Engulfing Patterns
- Bullish/Bearish Harami
- Dark Cloud Cover
- Piercing Line
- Morning Star
- Evening Star
Fourth, indicators. Any additional indicators pointing in the same direction will help increase the probability of success. Stephen Bigalow gives greatest emphasis to the stochastic oscillator. Other authors mention MACD, RSI, CCI, ADX/DMI, etc. All of them suggest that whatever indicator you use, it's a bad idea to trade against the indicator, since it would mean there is some opposing momentum that the trade would have to fight.
I still have quite a ways to go before mastering candlestick charting. But at least the basics are taken care of now.. I hope. :) Time to scan and backtest.

0 Comments:
Post a Comment
<< Home