Thursday, August 31, 2006

Wendy's and Tim Hortons

Wendy's is completing the spin-off of Tim Hortons through a special stock dividend. This dividend behaves somewhat like a stock split -- for every share of WEN that you own on the date of record, you will get 1.3593 shares (or so) of THI on the pay date. Then on the ex-date, the value of WEN will decrease by the value of THI. From that point forward, the two are completely separate, publicly traded companies.

There are a few interesting details on how a special stock dividend like this works:
  1. The IRS has ruled (search for "Internal Revenue Service") that this special stock dividend is not a taxable event. It must be because the combined value of WEN and THI on the pay date is the same as WEN's value before the pay date. So it behaves like a traditional stock split.

  2. You can't own fractional shares, so you get cash for that part instead, and that cash is a taxable event. If you are owed fractional shares due to the dividend, Wendy's will aggregate your fractional shares with other shareholder's fractional shares, sell them on the open market (the taxable event), and distribute the cash proceeds proportionately.

  3. Between the record and pay dates, there are two markets for WEN shares.
    1. The regular-way market uses the same WEN ticker symbol. It represents the shares before the stock dividend is paid. If you sell WEN shares in the regular-way market, you also sell your right to the stock dividend to the buyer! This is different from the typical cash dividend. With cash dividends, the ex-date is before the record date, so selling between record and pay dates still entitles you to the cash dividend. But for a stock dividend, the ex-date is after the pay date, so you have to hold the stock at least through the pay date to get the dividend. For the WEN/THI stock dividend, the only purpose of the record date seems to be the set the payout ratio of how many THI shares need to be delivered to each share of WEN.

    2. The when-issued market uses the WENWI ticker symbol. It represents the shares as if the stock dividend had already been paid but actually hasn't yet. Buying WENWI shares does not entitle you to the stock dividend. Adding the "WI" suffix to the base ticker symbol seems to be the standard practice for listing when-issued shares.

Restaurants and Coffee Shops - Reversing out of Downtrends?

Since early May, the larger coffee shops -- SBUX, PEET, and CBOU -- have shed about 25% in price. CBOU bottomed out at $6 (down 40%) on 8/7, but moved back up to $7.65 by 8/30.

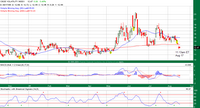
By comparison, COSI (which calls itself a "convenience dining restaurant" and has some coffee shops/kiosks in Macy's stores), is still down 45% from its high of $11 in early May, after a 4-month downtrend:

A head-and-shoulders bottom has formed over the last 6 weeks, and the most recent trading day shown (8/30) has double the 20-day average daily volume. The implied volatility is currently pretty high (over 70%), so I'm considering a covered call play to try to put delta, vega, and theta in my favor.

Also of interest in the Restaurants industry:
  • CAKE appears to be coming out of a 4-month downtrend with a head-and-shoulders bottom.
  • CEC has a 1-month rising wedge after downtrending for 3-months. Bearish signal?
  • RARE completed a successful head-and-shoulders bottom (though the breakout did not occur with strong volume), including a retest of the neckline. Will it now make a higher high?
  • PFCB has made a higher high and higher low after a 6-month downtrend. Will it make another higher high?
  • RRGB has been in a very wide-swinging 14-month downtrend. The $44 level is significant resistance. There is support around $40. Play the downward bounce to support?

Tuesday, August 29, 2006

Jimmy's Watch List 2006-08-29

Jimmy's current watch list:
  • Bullish -- CWTR, HCN, HCP, PVX, HPQ
  • Bearish -- CHS, BOH, DELL
  • Undecided -- USG, WIRE, AIV, AMD, AAPL

Using Yahoo Charts

Yahoo makes it easy to cruise through a bunch of stock charts all at once. Check out this link for REIT-Healthcare companies.

Watch List for Week of 8/28

Bullish:
  • ED - uptrend; oscillators suggest support bounce; but volume not matching uptrend.
  • NDAQ - 10% sideways channel; approaching support bounce
  • OXPS - uptrend; upcoming support bounce?
Bearish:
  • PFE - 20% upward over last two months; rising wedge over last month; declining volume on up days
    • 8/28 update: stiff intraday resistance at 27.75
  • FRE - possibly over-extended upward move (10% in 3 weeks); volume declining sharply as price approaches $64 resistance
  • PEIX - downtrend; 30/200-day SMA crossover on 8/1; oscillators peaking
  • BEAS - slight downtrend with 12% channel; at resistance with very weak volume and peaking oscillators

Monday, August 28, 2006

ETF Holdings

Have you ever wanted to know what stocks composed a specific ETF? Check these out:

  • Vanguard Vipers
    • You have to dig a bit to get to the complete holdings list.
    • Be sure to click on "Individual Investor" when asked. I had a harder time getting the full list when I clicked on Financial Adviser or Institutional Investor.

Friday, August 18, 2006

The Story on USG

I did some more digging and found some other interesting details.

USG had entered Chapter 11 back on June 25, 2001 as a pro-active defensive measure against mounting asbestos lawsuits. They have an FAQ's document about it. They were not actually in financial trouble at the time, but all their competitors had already filed Chapter 11, and USG found itself exposed to lawsuits where it would normally have limited or little liability. There were, however, legitimate asbestos claims mixed in with the noise, so USG found itself having to settle every claim that came in the door. Chapter 11 held off those lawsuits while USG came up with a plan for dealing with asbestos claims without short-changing either their creditors or shareholders.

It took 4 1/2 years of legal proceedings and finally on Jan 30, USG proposed a plan to deal with asbestos claims once and for all. It involved setting up a multi-billion dollar trust from which all present and future asbestos claims would be paid. $1.8B of the trust would be funded by a "Rights Offering" in which the right to purchase one (previously unissued) share of USG at $40 was granted to each existing share. So the ability to buy at $40 was available to every shareholder for a limited period of time. The plan was reviewed by the bankruptcy court and ultimately approved by the judge on Apr 10, pending approval by asbestos claimants.

That apparently went through, and on Jun 20, USG announced two things: they had emerged from Chapter 11 bankruptcy and the Rights Offering would be available to shareholders of record on Jun 30 through expiration on Jul 27. This Apr to Jul timeframe is when USG's stock price took that heavy dive, a combination of upcoming share dilution and huge supply at $40, and in Jun options volatility was 100-120% (buy puts!!!!!! sell calls!!!!!!). After Jul 27, part of the Jan 30 plan included the Backstop Commitment with Berkshire, which USG paid $67M for, where Berkshire was obligated to purchase shares under the Rights Offering and purchase any remaining unsold shares. So the 6.9 million share purchase on Aug 2 was a contractual obligation, and it explains why that one transaction more than doubled Berkshire's stake in USG.

So that takes a good bit of the wow factor out. But then, Warren did continue to buy 2 million shares of USG beyond what the Backstop Commitment required, and I somehow doubt it was for covering shorts. Maybe it means he believes the asbestos issues are now totally behind USG? And that mid-$40s is an excellent value for USG?

Thursday, August 17, 2006

Insider Trades on USG

I was roaming around the news and came across a blog about insider buying. Among those charts, USG caught my interest because there was a recent single insider purchase of nearly 7 million shares. Looking at insider trades, the big purchaser is Berkshire Hathaway, and Warren Buffet's signature is on the SEC filing (and link to search page). That got my attention! Looking more closely, Berkshire has been seriously loading up on USG shares for the past couple weeks -- a total of 9+ million shares purchased for $380+ million since Aug 2.

The technicals aren't there yet for a call entry, but oh is it tempting to just jump in now, maybe a LEAPS play. The implied volatility on USG is really low right now - about 36%.

VIX Options

The VIX looks like a really interesting possibility for call options, and I got some ideas about it from this article. The VIX "price" is range bound, has high volatility, and has rock solid support at 10. Open interest on specific contracts is often in the tens of thousands.

Right now, VIX is in the mid-12 range:
If it drops to the mid-11 range or lower, it becomes increasingly attractive for a call option play, since historically the VIX hasn't stayed that low for very long. For timing the entry, looking at a resistance bounce on the SPX would be appropriate, since the VIX is a contrarian indicator for the SPX.

For expiration month, take a look at the VIX $10 strike calls (prices as of 8/16 intraday):
Nov 2006 - $5.90 ask
Feb 2007 - $6.20 ask
May 2007 - $6.50 ask

Only 30 cents for 3 months extra time. Wow! And if you look at the price history of the VIX $10 call:
Even if you bought it at its highest peak and sold it at its lowest low (worst-case loss scenario), the loss is still under 50%. Of course, we can definitely do better than that with the entry and exit, so the probability of 50% loss for a VIX $10 call looks very low, as long as we close the position at least 10 weeks before expiration. On the upside, a 5-point move in the VIX corresponds roughly to a 25% gain for Feb07 $10 call. (The higher strikes, of course, have more potential upside and more risk.)

So, I am thinking about a VIX $10 Feb07 (or May07) call after a confirmed resistance bounce in the SPX. Exit would be at a support bounce on SPX chart.

Saturday, August 12, 2006

NASDAQ Composite Stochastic Indicators

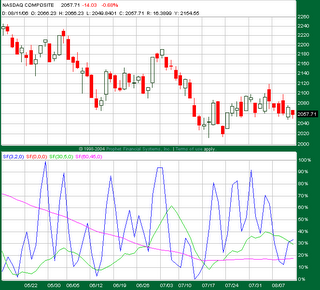
I've found the stochastic oscillator to be quite useful, especially when you look at it over multiple time frames. Here's a recent NASDAQ Composite chart with stochastic oscillators for 3-day, 30-day, and 60-day time frames:

Each indicator is as a "full stochastic" configured with the following periods:
  • Blue: %K = 3, smoothing = 2, %D = 0.
  • Green: %K = 30, smoothing = 5, %D = 0.
  • Magenta: %K = 60, smoothing = 45, %D = 0.
The green (30, 5, 0) Full Stochastic in particular seems pretty good at indicating reversals, especially when it's in the overbought (above 80%) or oversold (below 20%) zone. The above chart doesn't show an example of overbought, but if you apply these stochastics to older time periods or other indexes or even individual stocks, the (30, 5, 0) Full Stochastic often works as extra confirmation of a bounce from a top/bottom.

Watch List for Week of 8/14

Potential plays for this week, found using this search and the NASDAQ Guru Analysis page --

Bullish:
  • AZN, SAY - potential upcoming support bounces. Not sure if 30-DMA or rising trendline is better as support.
Bearish:
  • TDW - in horizontal trading channel ($42-$50) with retracement level at $46.50; MACD and 14,5 stochastics declining => potential resistance bounce.
  • EBAY - strong downtrend; bearish engulfing candle on 8/11 with volume at resistance; MACD declining => potential resistance bounce.
  • DPZ - downtrend; doji candle on 8/11 with weak volume at resistance; MACD and 14,5 stochastics declining => potential resistance bounce.
  • TOL - downtrend; strong volume on bounce down from resistance; MACD and stochastics declining with break through 30-day MA (=> 3 red arrows) => bounce already confirmed, and still has 10% move remaining before support.
  • BC - downtrend; bouncing off 30-day MA; MACD and stochastics declining