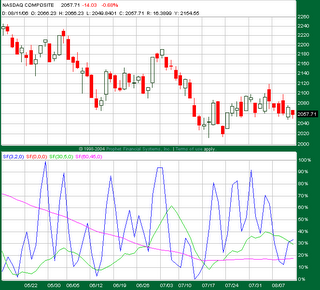
NASDAQ Composite Stochastic Indicators
I've found the stochastic oscillator to be quite useful, especially when you look at it over multiple time frames. Here's a recent NASDAQ Composite chart with stochastic oscillators for 3-day, 30-day, and 60-day time frames:
 Each indicator is as a "full stochastic" configured with the following periods:
- Blue: %K = 3, smoothing = 2, %D = 0.
- Green: %K = 30, smoothing = 5, %D = 0.
- Magenta: %K = 60, smoothing = 45, %D = 0.

0 Comments:
Post a Comment
<< Home